Metrics that win brand bookings: calculate ROI for sports photo campaigns
Brands do not book on gut feeling anymore. They want proof that every sports photo you shoot converts attention into measurable sales or brand lift. This guide gives you a step-by-step roadmap to identify, track and present the metrics that win brand bookings, calculate ROI for sports photo campaigns and secure repeat contracts.
The new rules of ROI in sports photography
Return on investment used to be a vague promise of “great exposure.” Today, marketing managers demand numbers that translate visuals into revenue. They compare your offer with data they already gather from paid media, so you must speak the same metric language.
Four ROI pillars you must master
- Reach & visibility – How many qualified eyeballs see your images?
- Engagement quality – Do viewers stop scrolling, share or click through?
- Conversion impact – How many leads or sales stem from your photos?
- Lifetime value uplift – Do your visuals boost long-term fan loyalty and repeat purchases?
Pre-campaign planning: set measurable goals
Align with brand KPIs first
Before you pitch a shot list, ask the brand which marketing KPI matters most this quarter: ticket sales, jersey pre-orders, app installs, or sponsor impressions. Tie every requested frame to that single KPI.
Create a metric matrix
| Photo deliverable | Primary KPI | Tracking tool | Success benchmark |
|---|---|---|---|
| Hero celebration shot | Social shares | UTM link in caption | 5 % share rate within 24 h |
| Behind-the-scenes carousel | Email sign-ups | Unique QR code | 1 000 new subscribers |
| Branded action GIFs | Sticker downloads | App analytics | 10 000 installs |
| Interactive 360° stadium shot | Merch clicks | Hot-spot heat map | 3 % click-through |
This matrix keeps the creative team, the marketing department and you accountable. It also provides the skeleton for your later ROI report.
During the shoot: capture data while you capture moments
Use smart filenames and metadata
- Add UTM codes to every captioned post to trace referral traffic.
- Embed alt text with the phrase “metrics that win brand bookings” and relevant keywords for SEO wins.
- Apply AI tagging for action shots to auto-classify players, sponsors and emotions, saving hours in post-production.
Instant feedback loops on site
Tether your camera to a tablet where the brand's social team previews shots, adds trackable stickers and publishes in real time. Fast deployment equals fresher engagement spikes and cleaner attribution.
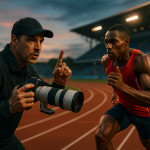
Post-campaign: calculate ROI step by step

From raw analytics exports and attribution models to concise dashboards, the post-campaign phase translates shutter clicks into euros. The forthcoming illustration visualises a photographer reviewing multi-channel charts, overlayed with jersey sales spikes, QR scan maps and ROI percentages, reminding readers that data storytelling seals the next brand booking.
1 – Gather raw data
- Export analytics from social platforms, the e-commerce back-office and newsletter tools.
- Pull referral numbers from Google Analytics filtered by your campaign UTM codes.
- Collect earned-media screenshots to quantify PR value.
2 – Match revenue to visuals
Create a pivot table where every revenue line (tickets, jerseys, sponsor clicks) links back to the originating image set by its unique code. If multiple assets contributed, apply an even or time-decay attribution model.
3 – Compute the ROI formula
ROI = (Net revenue attributed – Total production cost) ÷ Total production cost × 100
Sample calculation
- Net revenue attributed to campaign visuals: €80 000
- Total production cost (prep, shoot, retouch, rights): €20 000
- ROI: (80 000 – 20 000) ÷ 20 000 × 100 = 300 %
A 300 % ROI becomes a headline you can showcase in pitches, directories and on the sports photographers directory where brands shop for proven talent.
Presenting ROI to win the next booking
Visual dashboards beat spreadsheets
Convert your pivot table into a one-page dashboard: bar charts for revenue per asset, pie charts for audience segments reached. Clients digest visuals faster than cells filled with numbers.
Narrate the business story
“One photo series drove a 42 % uplift in jersey sales within 48 hours, delivering a 300 % ROI at one-third the cost of a traditional TV spot.”
Concrete comparisons like this move budget from TV or generic digital ads to your next shoot.
Package insights as value-add
- Recommend image ratios that performed best.
- Share ideal posting times based on engagement peaks.
- Suggest add-on formats (short-form reels, GIF stickers) to amplify future ROI.
Pricing models that align with ROI
A flat day rate hides value creation. Instead, propose:
- Tiered usage fees linked to reach brackets (e.g., +10 % fee if impressions exceed one million).
- Revenue share add-ons for merch photos that drive sales.
- Retainers where you supply ongoing content and optimisation advice, similar to the agreements outlined in freelance photo contracts.
Boost metrics with operational tweaks
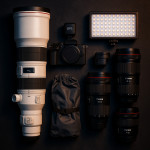
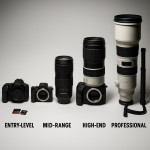
Gear and workflow
Fast autofocus primes and dual card slots cut missed moments and data loss, directly improving usable image volume. For a complete gear checklist, read this gear roadmap.
Niche storytelling
Specialise in a sport or narrative angle—such as athlete recovery—to stand out. See stadium-flash to story for inspiration.
Case study snapshot
During a regional basketball final, a photographer shot 120 deliverables at €12 000 total cost. The images generated:
- €25 000 in digital merch sales (tracked via QR codes)
- €8 000 in sponsor referral clicks
- €9 000 media-value equivalent from press pickups
Total revenue attributed: €42 000. ROI: (42 000 – 12 000) ÷ 12 000 × 100 = 250 %. The brand renewed for a full season retainer.
Quick self-audit checklist
- Have you assigned one KPI to every shot?
- Are UTM codes embedded in captions before posting?
- Do you have cost tracking down to equipment rental?
- Can you export platform analytics in under five minutes?
- Is your dashboard client-ready within 72 hours of event end?
Mini-quiz: test your ROI readiness
FAQ
- How often should I report ROI to a brand client?
- Send a mini-dashboard within 72 hours for excitement, followed by a full report after 14 days when sales data mature.
- What if a single photo appears in multiple channels?
- Use multi-touch attribution models. Assign weighted percentages based on first-touch, last-touch or time decay to avoid double counting.
- Can smaller local teams apply the same metrics?
- Yes. Replace sales with ticket scans or sponsor coupon redemptions. The formula stays identical.
- Which tool tracks QR codes best?
- Most CRM systems have built-in QR analytics. For quick setups, free services like Bitly also log scans and referrers.
- Do brands pay extra for detailed ROI reporting?
- Many do. Position data reporting as a premium add-on or bundle it inside a retainer for continuous value.
Key takeaways and next action
- Metrics that win brand bookings link every visual to a brand KPI.
- Calculate ROI with clear cost tracking and channel-level attribution.
- Present results visually and propose data-driven next steps.
Ready to turn your next sports shoot into a proven revenue driver? Book a discovery call and let's outline the metrics that win brand bookings for your upcoming season.