Fan data dashboards: insights hip-hop singers use to spark label A&R interest
Hard numbers beat hype. A&R scouts now open dashboards before they open demo files. Learn how hip-hop singers consolidate streaming, social and merch stats into punchy fan data dashboards that convince labels they are worth signing.
Why fan data dashboards are the new demo tape
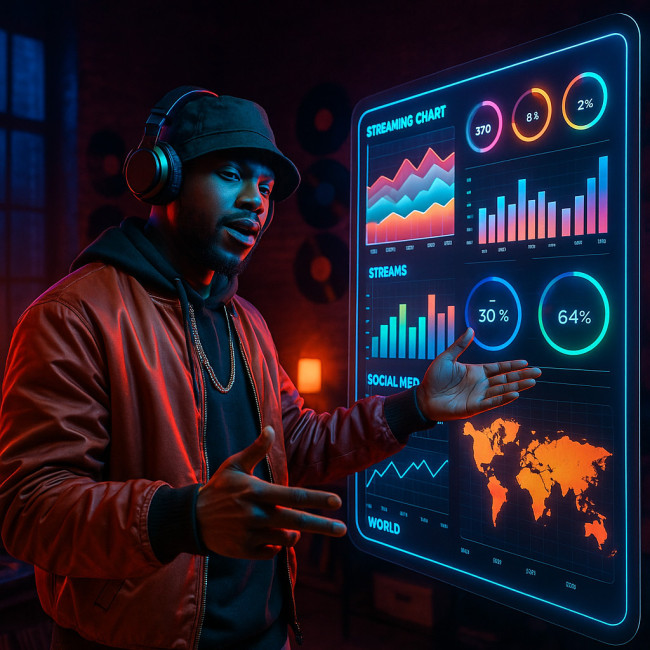
The hip-hop singer directory on Artfolio receives thousands of clicks a week, yet only profiles that prove fan traction earn callbacks. A clean fan data dashboard turns scattered metrics into one persuasive snapshot, shortening discovery time for decision-makers and putting you ahead of equally talented rappers still emailing PDFs.
Three macro-shifts pushing data-first scouting
- Streaming saturation: 100k+ tracks hit DSPs daily, so A&R filters by growth velocity rather than raw streams.
- Short-form video boom: Viral spikes are easy; sustained retention is rare. Dashboards surface repeat watchers and save rates.
- Remote deal flow: Labels sign artists worldwide without in-person showcases. Data replaces club buzz as due diligence.
Source : Spotify Charts
Even superstars publish listener trends on socials to demonstrate staying power. Emerging rappers can do the same at micro scale, spotlighting week-over-week gains and outlier markets.
Key metrics A&R teams scan first
| Metric | Why it matters | Benchmark to aim for |
|---|---|---|
| Monthly listeners ↗ | Shows current reach and market size. | 50 k+ for indie deal talks. |
| Listener growth rate | Signals viral momentum and marketing efficiency. | >15 % month-on-month. |
| Save-to-stream ratio | Predicts long-term catalogue value. | ≥10 % saves per stream. |
| Top city concentration | Guides tour routing and radio pushes. | No single city >20 % of listeners. |
| Short-form video completion | Validates visual identity & storytelling. | ≥40 % watch to end. |
| Merch conversion | Proves superfans will spend, not just stream. | 1 % of monthly listeners buy. |
Combine these numbers with qualitative proof—press clippings, playlist adds and social proof tactics—to address both head and heart of label execs.
Building a singer-friendly fan data dashboard
1. Aggregate streaming platforms automatically
Pull Spotify for Artists, Apple Music, YouTube and SoundCloud APIs into one sheet. Tools like Chartmetric or Viberate fetch data hourly; then feed a Looker Studio or Airtable base. Add custom calculated fields such as listener growth % and release day lift.
2. Layer social engagement signals
Followers alone mislead. Prioritise engagement per thousand, story replies and duet usage on TikTok. A simple bar chart of daily duet count often excites scouts more than raw views because it proves culture impact. See freestyle snippet tips for rapid content tests.
3. Visualise velocity, not vanity
Use arrow icons or green/red colour coding to highlight trends. A panel that shouts “+18 % listeners this week” is easier to digest than five tiny line graphs. Remember: labels dig stories, so annotate spikes (“playlist add on RapCaviar”) directly in the chart.
4. Map geography for hyper-local leverage
Plot top ten cities on a heat map. If second-tier markets like Denver or Lyon over-index, pitch micro-tour budgets to the label. You can also sharpen directory tags—read the genre-tag fine-tuning guide—to surface in region-specific searches.
5. Surface metadata health
Bad song credits tank discovery algorithms. Run an automated audit that flags missing ISRCs, writer splits and mood keywords. For a deeper dive, explore the metadata mastery checklist.
Case study: 90-day dash from underground to inbox
Artist: indie rapper “Nova Lines”.
Goal: secure discovery call with a major's urban division.
Process:
- Centralised streams, social and Bandcamp merch sales in Google Data Studio.
- Highlighted a 22 % monthly listener uptick post-collab single.
- Annotated a TikTok challenge that pushed 1 400 user-generated clips.
- Added narrative call-outs (“$14 average cart value”) next to merch KPI.
- Embedded live dashboard link on Artfolio profile and DM'd A&R assistants.
Outcome: Two label meetings booked. Feedback cited “clear data story” as the reason they listened to Nova Lines before the 30 other cold pitches that week.
Common pitfalls when sharing dashboards
- Static screenshots: Stale data kills excitement. Share a live link with viewer-only access.
- Data without context: Always annotate anomalies (e.g., a playlist drop) to avoid misinterpretation.
- Over-sharing sensitive info: Hide revenue numbers until NDA signed; focus on % growth instead.
- Ignoring storytelling: Pair charts with one-line takeaways so executives spend seconds, not minutes.
Quick self-test: Is your dashboard A&R ready?
FAQ
- What software is best for a beginner's fan data dashboard?
- Google Looker Studio is free and connects to Spotify, YouTube and Google Sheets with community connectors.
- How often should I update the dashboard link on my profile?
- Automate daily refresh. At minimum, review and validate numbers every Monday before outreach.
- Can dashboards replace traditional EPKs?
- No. They complement EPKs by quantifying reach, while EPKs provide brand story, photos and stage specs.
- Will sharing raw numbers hurt negotiation leverage?
- Share growth percentages publicly; reveal absolute revenue only after NDA to retain bargaining power.
- Do indie labels look at the same metrics as majors?
- Yes, but indie A&Rs may prioritise niche engagement (Discord churn, Bandcamp spend) over massive stream counts.
Turn insight into action
Fan data dashboards are not vanity projects—they are conversation starters. Build yours this week, embed it on every platform, and convert curiosity into signed term sheets.
Next step: Audit your metadata today using the guide linked above, then schedule a 30-minute executive summary call with your top label target.