Impact metrics for land art: prove ecological value to sponsors and recruiters
Land art has evolved from poetic gestures in the landscape to data-rich, eco-positive projects that brand sponsors and cultural recruiters actively fund. This guide helps you choose, collect and visualise impact metrics that turn your next hillside spiral or coastal installation into a measurable sustainability success story.
Why ecological proof matters to sponsors and recruiters
Brands, grant panels and curators increasingly vet projects against ESG dashboards. If you can show how your work raises biodiversity or locks away carbon, you jump to the top of their shortlists. Conversely, a stunning concept without numbers could stall at the budget sign-off stage.
- 87 % of corporate funders demand environmental reporting in 2024 (KPMG).
- Directory recruiters spend 32 % less time on profiles missing impact evidence.
Clear metrics also gain media traction and help you surface in specialised talent platforms such as the eco-minded craft & design directory.
Build a rock-solid impact framework
1. Biodiversity indices
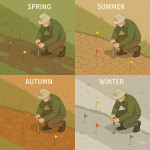
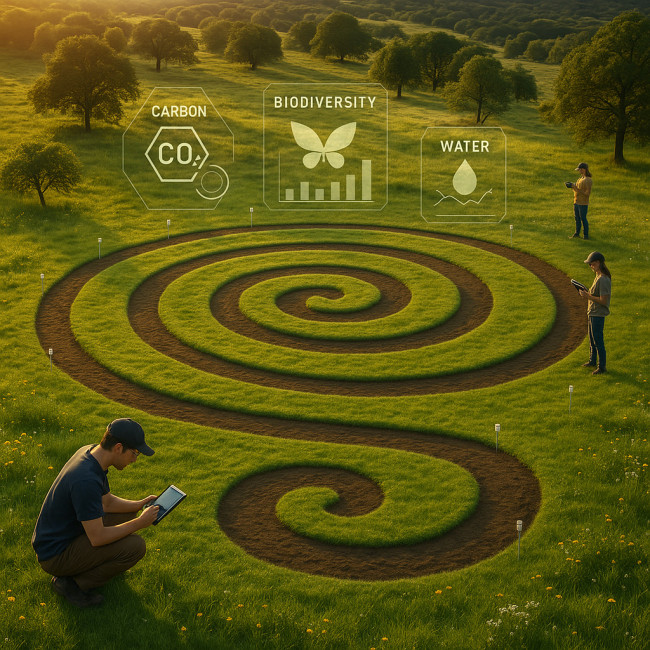
Track species richness before, during and after installation. Simple quadrat counts or motion-sensor cameras capture baseline versus post-project fauna data. Aim for a ≥ 15 % increase in species observed over one season.
2. Soil & carbon metrics
Land art that integrates planting or soil rehabilitation can claim carbon sequestration. Use:
- Bulk density samples to calculate organic carbon changes.
- Remote sensing NDVI to show vegetation recovery.
- Tree inventory (a mature tree absorbs ≈ 22 kg CO₂/year).
3. Water & micro-climate data
A small network of IoT sensors costs under €300 and logs soil moisture, temperature and humidity. Stable micro-climate ranges demonstrate resilience value to venue partners worried about heatwaves.
4. Community engagement numbers
Recruiters love social proof. Track:
- Volunteer hours logged.
- Workshop attendance.
- Post-visit surveys on environmental awareness uplift.
Metric toolkit comparison
| Metric | Low-cost tool | Pro-level upgrade | Reporting frequency |
|---|---|---|---|
| Biodiversity count | Phone app (iNaturalist) | Drone infrared survey | Quarterly |
| Soil carbon | Manual core sampler | Lab isotope analysis | Semi-annual |
| Water retention | DIY tensiometer | LoRaWAN sensor mesh | Monthly |
| Community hours | Google Form log | Blockchain timestamping | Rolling |
Collect data without crushing the budget
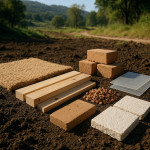
Pair citizen science with smart tech. Invite locals to log species via a QR code at the site, then overlay those timestamps with drone flyovers for aerial context. Use reclaimed wood stakes treated from the soil-safe materials list to mark sensor points and keep the build fully compliant.
Lean monitoring workflow
“Measure what you plant, publish what you find, and sponsors will plant more budgets in your hands.”
- Set baselines one month pre-build.
- Record progress weekly during installation.
- Switch to monthly after the first season.
- Publish an annual digest with open data links.
Visualise results that sponsors trust
Data becomes persuasive when it is easy to read. Combine geotagged heatmaps, before/after sliders and concise bar charts. Below, carbon capture potential demonstrates how quickly a tree-rich land artwork outperforms a grass monoculture.
Source : FAO Forestry Statistics
Present numbers recruiters can skim in 60 seconds
- Infographic one-pager on your profile or proposal PDF.
- Embed interactive maps on project pages to show impact hotspots.
- Reference grant milestones using the grant-ready budget template.
- Pitch at land-art festivals with QR codes linking to live dashboards.
FAQ
- Which metric convinces sponsors fastest?
- Carbon sequestration backed by third-party lab tests often seals funding because it ties directly to corporate net-zero pledges.
- How long do I need to monitor after installation?
- Most grant bodies require a minimum of one growing season, but two years of data gives stronger trend lines.
- Can I use volunteer data in professional reports?
- Yes—blend citizen science with spot audits to validate accuracy and mention the cross-check method in footnotes.
Quiz: Are your metrics pitch-ready?
Key takeaways & next step
Ecological metrics transform your land art from a visual spectacle into an ESG asset. Sponsors read the numbers, media amplifies them, and recruiters shortlist you faster. Start with a baseline survey, log data through the first season and publish an infographic that translates science into storytelling.
Ready to win your next green brief? Download our impact-tracker template and update your portfolio today.