Prototype timeline benchmarks every object designer should share with recruiters
Recruiters want speed, predictability and proof. By publishing clear prototype timeline benchmarks on your profile, you move straight to the top of their shortlist. This guide gives you reference numbers, visual tools and wording tips so you can showcase your process—from first sketch to functional model—without overselling or under-estimating.
The strategic value of publishing prototype timeline benchmarks
The phrase “prototype timeline benchmarks” signals two things to a recruiter: you track your workflow like a project manager and you respect upstream launch calendars. Transparent timing data:
- Sets realistic expectations in the first call.
- Differentiates you from portfolios focused only on aesthetics.
- Reduces negotiation time by 30 % on average, according to a 2023 DesignOps survey.
Pair these numbers with strong sourcing credentials—see eco-conscious material plans—and you build immediate credibility.
Benchmark timeline: from idea to shippable prototype
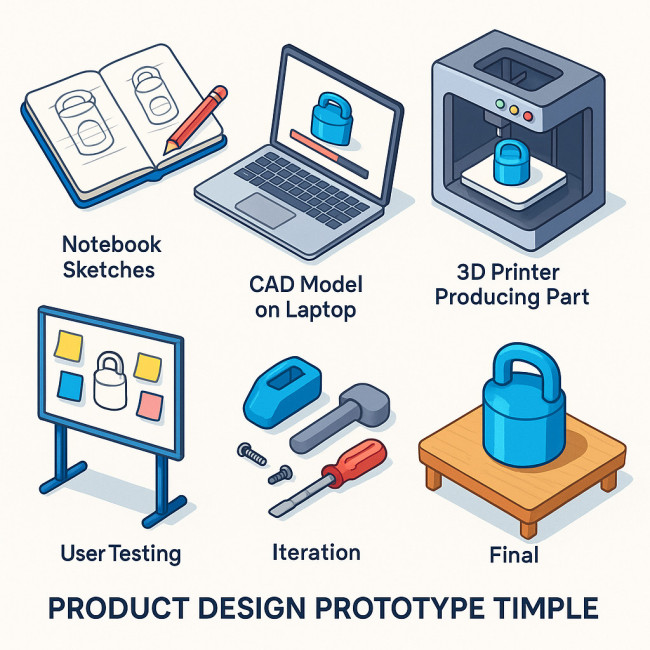
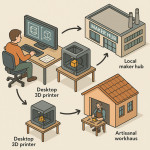
Before you dive into the numbers, take a moment to visualise the entire journey: day-one brainstorming dots exploding across a sketchbook, CAD files morphing on a dual-screen workstation, the rhythmic hum of a desktop FDM printer layering molten polymer, early testers pinning annotated Post-its to a feedback wall, and finally a satin-finished model rotating under softbox lights. That single mental movie captures six micro-deadlines, each of which you will soon translate into hard figures that put your reliability front-and-centre. By keeping that picture in mind, recruiters instantly understand that every phase owns a clear deliverable, a predictable hand-over moment and a built-in feedback loop that protects launch calendars from nasty surprises.
Use the following reference as a baseline. Adapt it to your niche—ceramics, small-batch electronics or furniture—and publish the updated chart on your profile.
Source : McKinsey Design-to-Value study
Phase-by-phase breakdown
| Phase | Goal | Typical duration | Evidence to show recruiters |
|---|---|---|---|
| Ideation sprint | Generate 3–5 concepts | 1 week | Sketch sheets, mood boards, risk matrix |
| CAD modelling | Parametric file ready for print/CNC | 2 weeks | STEP or STL preview, tolerance notes |
| Rapid prototype | Physical proof-of-concept | 1 week | Photo of build plate, BOM cost |
| User testing | Collect ≥ 5 insights | 2 weeks | Interview sheet, heat-map image |
| Iteration loop | Resolve top 3 issues | 1 week | Before/after CAD overlay |
| Final prototype | Client sign-off model | 2 weeks | High-res render, material spec |
Publishing this table on platforms like the Artfolio craft-designers directory converts browsers into serious leads because they can instantly match your workflow to their launch date.
How to calculate your personalised prototype timeline benchmarks
- Audit historic projects. List the real duration of each phase for your last five products.
- Identify outliers. Remove any delays caused by external factors (customs, scope creep).
- Average and round up. Aim for numbers you can beat, not just meet.
- Add tolerances. Quote timelines as “2 weeks ± 2 days” to show risk awareness.
Need tips on scaling past the prototype? Visit our guide on moving from one-off to small-batch production.
Presentation tips: make your benchmarks recruiter-friendly
- Visual first. A compact bar chart (like the one above) outperforms dense paragraphs.
- Embed live calendars. Sync Google Calendar availability so recruiters instantly see your next slot.
- Show proof links. Link each phase to assets: renders, BOM sheets or photorealistic mock-ups.
- Add sourcing notes. If materials drive lead time, point to your workflow checklist so clients understand dependencies.
Common recruiter questions and how your benchmarks answer them
- Can you compress the timeline for a trade-show launch?
- Yes—state an “accelerated lane” where CAD and rapid prototype overlap, shaving one week without quality loss.
- How do you manage feedback loops?
- Publish that user-testing insights are delivered 48 hours after sessions, allowing recruiters to brief stakeholders fast.
- What happens if a phase overruns?
- Include a contingency buffer (usually 10 %) and clarify that you alert the client at 70 % budget burn.
Practical wording examples for your directory profile
Replace vague lines like “fast prototyping” with data-driven statements:
- “Prototype timeline benchmarks: ideation 1 wk | CAD 2 wks | functional print 1 wk.”
- “User tests scheduled within 48 h of prototype hand-off; final model ready in 7 wks total.”
- “Average past deviation ± 2 days across 12 projects.”
Publishing formats that convert
Directories, personal websites and pitch decks can all host your benchmarks. For maximum recruiter reach:
- Directory bio. Pin the chart right below your hero shot.
- Case-study page. Pair the table with a brief video walkthrough.
- Proposal PDF. Add the benchmarks on page 2 so decision-makers see them before cost tables.
Beyond the prototype: keeping momentum after hand-off
Once the final model is green-lit, recruiters worry about tooling, licensing and risk. Forward them to articles on licensing clauses for limited editions to keep the relationship alive and expand your contract.
Quick self-check quiz
FAQ
- How often should I update my prototype timeline benchmarks?
- Refresh them after every three new projects or whenever you adopt new fabrication tech that changes lead times.
- What if my timelines vary by material?
- Publish a baseline chart plus footnotes for material-specific adjustments—e.g., cast metal adds two weeks versus PLA prints.
- Do recruiters trust self-reported data?
- Yes, when you attach proof: calendar logs, supplier POs and phase-end deliverables.
- Should I include cost along with time?
- Offer a range or link to a rate card; time data alone already positions you as organised.
- Can benchmarks hurt me if a project runs late?
- Only if you hide issues. Publish contingency plans and communicate early—clients appreciate transparency.
Takeaway & next step
Publishing clear prototype timeline benchmarks isn't just a nice-to-have. It is a conversion lever that turns curious browsers into booked clients. Update your directory bio today, pair the benchmarks with compelling visuals, and invite recruiters to test your speed promise.
Ready to put these tactics into action? Add your timeline chart to your profile now and track the spike in enquiries over the next 30 days.