Urban biodiversity metrics: convince recruiters your landscapes boost city health
Urban biodiversity metrics turn your green vision into hard numbers recruiters understand. Follow this guide to measure, present and sell the ecological value of your landscape projects in any tender or online directory.
Why recruiters now shortlist data-driven landscape designers

City planners, hospitality groups and commercial developers increasingly add biodiversity targets to their briefs. When you present urban biodiversity metrics—rather than a collage of lush images—you prove the long-term value of your work and speed up decision cycles. Recruiters browsing platforms such as Artfolio's spatial-design roster confirm that designs backed by metrics move straight to the interview pile.
The 5 biodiversity metrics that speak every recruiter's language
1. Native species richness
Count the number of resident flora and fauna species within the project perimeter. A rise of 20 % or more signals ecosystem recovery and boosts a property's ESG score.
2. Habitat connectivity score
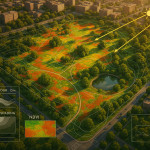
Use GIS heat-maps to measure how your plot links to surrounding green corridors. A connectivity gain above 0.15 increases pollinator movement and reduces maintenance costs.
3. Tree canopy cover percentage
Shade equals comfort and lower energy bills. Target a 30 % canopy cover; each additional 10 % can drop neighbourhood summer temperatures by 1 °C.
4. Pollinator abundance index
Track bee and butterfly visits with low-cost camera traps. An index above 1.4 compared to the city baseline reassures food-service clients about on-site herb gardens.
5. Soil organic carbon content
Healthy soil locks carbon and nurtures root systems. Aim for ≥ 5 % organic matter; the figure doubles as a resilience metric against heavy rainfall.
Field methods that won't break the budget
- Quadrat sampling for species richness: record every two weeks during the first year.
- Drone flyovers to map canopy cover—sync the flight plan with GIS layers for instant recruiter-ready visuals.
- Infrared soil probes for organic carbon: each reading costs less than a lab test and fits into most SME budgets.
- Citizen-science apps like iNaturalist to crowd-verify pollinator counts.
Turn raw data into persuasive stories
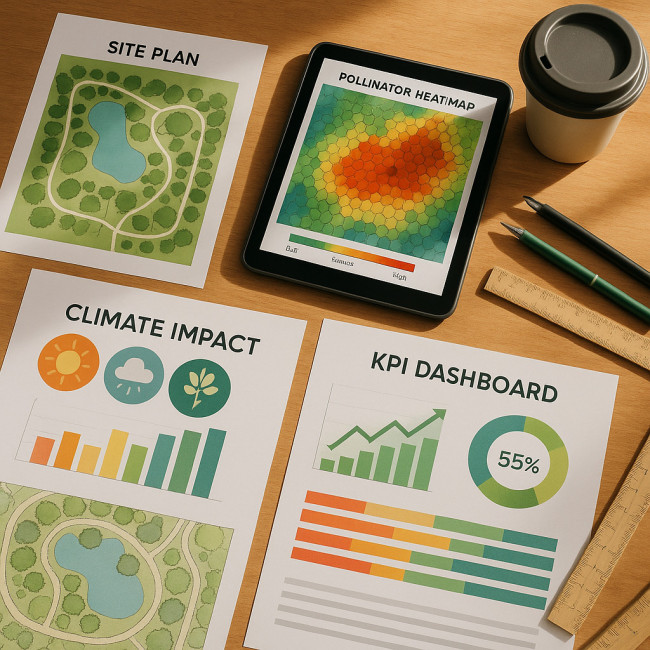
You collected the numbers—now format them for busy talent scouts. Combine yearly trend lines, infographics and concise bullet points that link each urban biodiversity metric to ROI: lower HVAC bills, higher footfall or better ESG ratings. Publishing those insights on directory profiles increases views by up to 38 % according to internal Artfolio analytics.
Source : European Environment News
Comparison table: metric, tool, recruiter benefit
| Metric | Low-cost tool | Value for recruiters |
|---|---|---|
| Species richness | Quadrats + mobile ID app | Proves ecological legitimacy |
| Connectivity | Open-source GIS | Mitigates wildlife-vehicle collisions |
| Canopy cover | Drone orthophotos | Cools micro-climate, cuts AC spending |
| Pollinator index | Camera traps | Assures urban farming potential |
| Soil carbon | Infrared probe | Locks CO₂, supports ESG reporting |
Case study: turning a car park into a micro-forest
After removing 2 300 m² of asphalt, the design team planted 34 native tree species and lifted canopy cover from 0 % to 35 % in three years. Pollinator visits quadrupled, and local retail sales rose 12 % during summer, mirroring data shared in our impact-metrics deep dive. The project was shortlisted within 48 hours on a public tender thanks to a concise one-page dashboard.
Secure extra shortlist points with material choices
Pair your metrics with cradle-to-cradle paving and FSC timber. Need a primer? Read this guide on sustainable sourcing to give your numbers even more punch.
Optimise your directory listing
Embed the dashboard in your portfolio, add geo-tags and choose smart filters as described in our directory optimisation tutorial. Recruiters love one-click evidence.
Common pitfalls—and the fixes
- Over-promising targets: use baseline data to set realistic improvements.
- Ignoring maintenance: propose seasonal care packages; see our maintenance revenue playbook.
- Data overload: highlight three metrics max on the first slide.
- Lack of context: benchmark against city averages, not pristine forests.
Quick quiz: are your metrics recruiter-ready?
FAQ
- How often should I update my urban biodiversity metrics?
- Collect quarterly data during the first two years, then bi-annually to show trend stability.
- Can I use citizen-science data in professional tenders?
- Yes, if you cross-validate at least 10 % of observations with expert surveys.
- What metric weighs most in ESG reporting?
- Soil organic carbon, because it links directly to Scope 3 emission reductions.
- Do biodiversity dashboards fit in small-scale projects?
- Absolutely. Even a 200 m² pocket park can show pollinator and canopy gains.
- How do I price metric collection?
- Add a data-management fee line in your quote—see our pricing guide.
Key takeaways
Urban biodiversity metrics translate ecological intent into recruiter-friendly evidence. Track five core indicators, visualise them clearly and embed the story in your online profiles. You will climb shortlist rankings, win greener clients and boost city health one project at a time.
Ready to impress? Update your next proposal with these metrics and watch responses triple.