Neighborhood impact data: prove murals drive foot traffic and justify budgets
Wondering whether large-scale murals genuinely boost neighborhood foot traffic or if the hype is just spray-painted smoke? In this guide, you'll learn exactly which neighborhood impact data to capture, how to visualise the uplift, and how to translate those numbers into a convincing budget pitch for sponsors, city councils and brand partners.
Why “neighborhood impact data” matters to every mural project
City planners, brand marketers and local shop owners increasingly ask for hard neighborhood impact data before green-lighting a mural. They crave proof that art on walls translates into feet on sidewalks, sales in tills and buzz online. Without the numbers, even the most dazzling concept can stall in the approval queue.
- Accountability: Public funds and corporate sponsorships demand ROI transparency.
- Competition: Out-of-home formats such as digital billboards publish impression metrics—murals must match that clarity.
- Longevity: Data extends mural life spans by demonstrating year-on-year value during maintenance budget cycles.
Key metrics that prove murals drive foot traffic
1. Footfall uplift
Measure the change in average daily pedestrian counts within a defined radius before and after installation. Bluetooth beacons, anonymised mobile data or simple infrared counters work well.
2. Dwell time
Smart cameras calculate how long people pause near the wall. A longer dwell indicates higher engagement and stronger potential for local spending.
3. Social amplification
Track geo-tagged posts, hashtag mentions and photo shares. A spike signals that the mural extends neighborhood reach beyond physical visitors.
4. Business revenue shifts
Compare sales data from nearby cafés and boutiques. Even a 5 % lift during the first month can persuade skeptical stakeholders.
Need a refresher on collecting street-level retail metrics? Our guide on tracking footfall data to prove merchandising ROI breaks down low-cost sensor options.
Gathering neighborhood impact data step-by-step
Step 1 – Establish a reliable baseline
Begin counting at least four weeks before the first drop of paint. Record:
- Average pedestrian count (weekday vs. weekend)
- Median dwell time
- Existing hashtag volume
Step 2 – Capture the “during” buzz
The painting phase itself can create a mini-festival atmosphere. Log temporary spikes separately so the post-launch data remains clean.
Step 3 – Monitor the first 90 days post-launch
Install sensors or pull mobility reports weekly. Most murals reveal their strongest uplift window during this period.
Step 4 – Layer qualitative feedback
Short interviews with passers-by and retailers add human stories that convert dry statistics into memorable talking points.
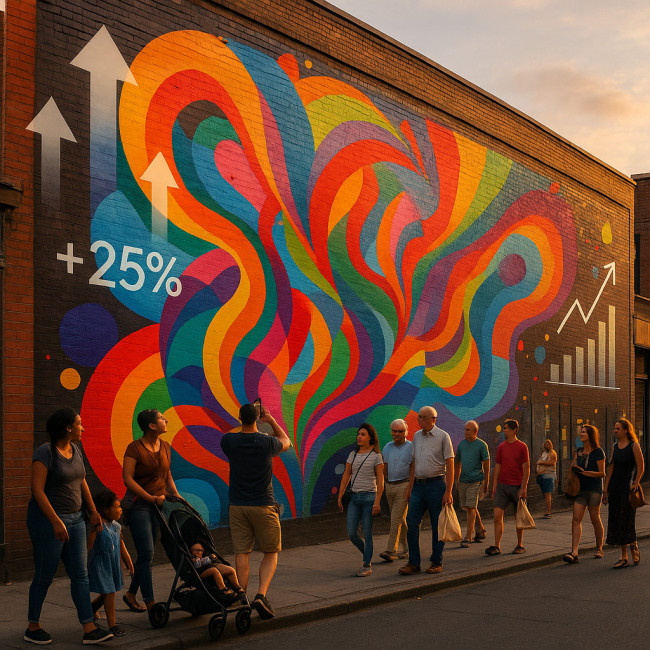
Case study comparison
| Project | City | Foot traffic uplift | Dwell time change | Local sales shift |
|---|---|---|---|---|
| “Future Faces” | Wynwood, Miami | +25 % | +38 % | +17 % |
| “Industria Viva” | Bushwick, NYC | +14 % | +21 % | +8 % |
| “Laneway Lights” | Fitzroy, Melbourne | +20 % | +31 % | +12 % |
All three projects used identical sensor models and a consistent 100-metre radius, making the neighborhood impact data directly comparable.
Visualising the uplift for fast stakeholder buy-in
Source : Mural Arts Program Reports
Turning neighborhood impact data into a winning budget pitch
- Translate percentages into currency. A 20 % footfall uplift around independent retailers averaging €1 500 daily sales equals €300 extra per day.
- Anchor ROI against traditional media. If a three-month billboard costs €25 000 for an estimated 500 000 impressions, demonstrate how your mural reaches a comparable audience for less and remains visible for years.
- Highlight spill-over effects. Increased safety perception, graffiti deterrence and tourism coverage add intangible value that outweighs initial paint and lift rental costs.
- Offer ongoing reporting. Pledge quarterly data snapshots to reassure funders their investment keeps paying dividends.
For detailed cost planning, explore the urban mural budget builder. It breaks down surface prep, artist fees and equipment rentals—perfect for lining up with your projected ROI.
Compliance and long-term visibility
Neighborhood impact data convinces officials, but permits still rule the streets. Our primer on public art permit pathways walks you through timelines so data collection never outruns legal approvals.
After completion, embed a scannable QR or NFC plaque linking to geo-tagging tactics. Visitors share precise locations, compounding your neighborhood impact data without extra spend.
Mural + brand = amplified metrics
When corporate sponsors help fund a wall, the data stakes climb higher. Learn to protect artistic voice while meeting KPIs in our guide to brand-street art deals that boost campaign reach.
Need creative resources? Browse professional mural image designers who can incorporate impact-ready storytelling into the artwork itself, prompting selfies and organic hashtag growth.
FAQ
- How many weeks of baseline data do I need?
- Four weeks capture market cycles such as paydays and weekend peaks, giving enough context to isolate mural impact.
- Which sensor is most cost-effective for footfall counts?
- Infrared door counters start at around €300, require no personal data collection and integrate easily with cloud dashboards.
- Do I need audience consent to use anonymised mobile data?
- Mobile data aggregators provide GDPR-compliant, de-identified metrics. Always request documentation before purchase.
- What if dwell time drops after three months?
- Rotate lighting, host micro-events or add AR filters to refresh interest and push the next data spike.
- How often should I report results to sponsors?
- A 30-, 60- and 90-day cadence keeps momentum high and budgets flowing for maintenance or future walls.
Quick knowledge check
Wrap-up and next steps
Armed with neighborhood impact data, you can transform a beautiful concept into a fully funded community landmark. Install sensors, track the numbers, and watch your mural budget approval rate climb.
Ready to pitch? Download our free mural ROI worksheet and start plugging in your own figures today.