Window display ROI: track footfall data that proves merchandising boosts sales
Wondering whether the hours and budget you pour into visual merchandising genuinely translate into more shoppers and higher sales? This guide explains how to capture footfall data, link it to revenue, and present clear ROI figures that make budget approvals painless.
Why footfall is the most persuasive KPI for window displays
Footfall counts every person who walks through your door. When you tie that stream of visitors to average transaction value (ATV) and conversion rate, you obtain a crystal-clear picture of how a new display affects revenue.
- Objective evidence : Unlike “likes” on a social post, footfall is a physical action.
- Fast feedback : Sensors deliver hourly data, so you can tweak lighting or focal points in real time.
- Comparable across stores : Chain retailers benchmark performance between branches and share best practices.
The essential tech stack for tracking footfall
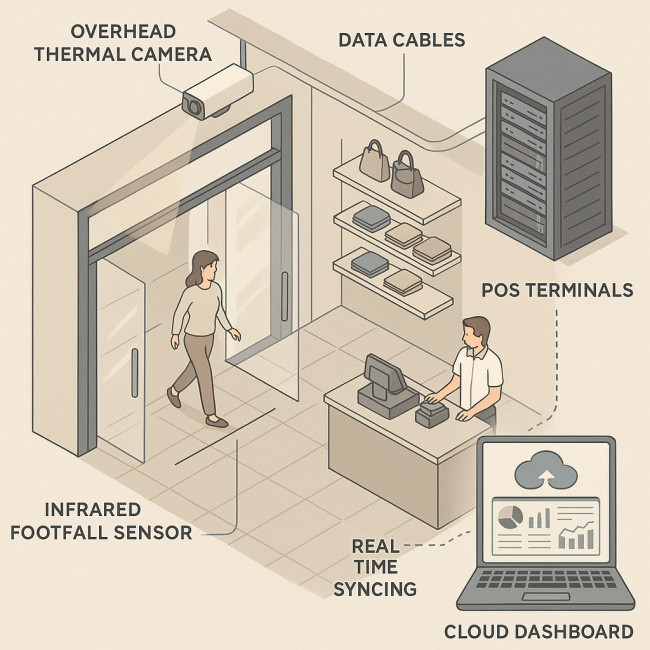
From the moment a passer-by crosses the threshold, every data point has to travel through a tightly orchestrated chain of hardware and software. Imagine discreet infrared sensors mounted above the automatic doors, their dual beams silently distinguishing adults, children and delivery staff. The headcounts they register flow via PoE cabling into an edge computer that uploads anonymised packets to the cloud every 60 seconds. There, an API marries the visitor timestamps to transaction logs pulled from the POS, enriching each line item with channel, time of day and staff roster metadata. Finally, an intuitive dashboard converts the raw stream into colour-coded widgets that visual merchandisers, area managers and finance teams can all understand at a glance. By automating this pipeline up-front, you free store staff from manual clicker counts and gain the real-time clarity needed to iterate displays before the weekend rush.
1. Smart sensors at each entrance
Infrared or stereoscopic cameras count entries and exits, filtering out staff and delivery drivers. Prices start at €250 per doorway, and installation rarely exceeds 30 minutes.
2. POS integration
Link sensor timestamps to your POS. That correlation turns raw visitor numbers into the metrics that matter: conversion rate and ATV.
3. Dashboard & alerts
Select a platform that triggers an SMS or Slack alert when visitor spikes occur. Real-time nudges let in-store teams restock hero products before shelves look bare.
Step-by-step: prove display ROI in under four weeks
- Baseline week – Record footfall and sales with the existing display.
- Display changeover – Capture clear “before” photography, note lighting settings, and ensure staff behaviour remains constant.
- Test period (weeks 2-4) – Monitor sensors daily; log any promotions that could skew data.
- Calculate lift – Compare footfall, conversion and revenue to the baseline. Anything above a 5 % uplift is usually enough to cover production costs.
- Present findings – Visualise results in a simple chart and pair with shopper quotes gathered on the shop floor.
Case snapshot: footwear retailer increases weekly sales by 24 %
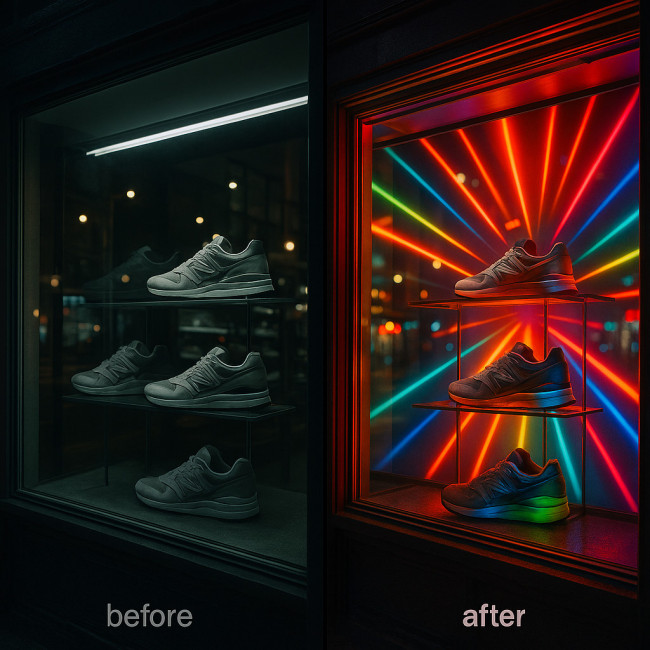
Before diving into the numbers, visualise the store façade on a gloomy Tuesday evening. In the baseline configuration, passers-by saw a static row of mannequins framed by fluorescent tubes that bled into the pavement glare. The merchandising team swapped that arrangement for a kinetic LED backdrop programmed to ripple in sync with social-media-inspired colour gradients. Each time motion sensors detected a passer-by within a three-metre cone, the lights pulsed to spotlight the hero sneaker of the week. Crucially, identical price points, staffing levels and promotional calendars were maintained, isolating the effect of the visual overhaul. What unfolded over the next three weeks was a sustained uptick in doorway flow, longer dwell times and a 24 % lift in weekly sales—proof that creativity paired with measurement pays dividends.
One mid-tier sneaker chain tested a motion-activated LED backdrop inspired by phygital shopfront tactics. Sensors at the main entrance tracked six weeks of data.
Source : Retail Dive
After the display refresh in week 3, footfall leapt 30 % and weekly revenue gained €12 400. Crucially, the LED setup cost €3 800, meaning payback landed within ten days.
Five optimisation levers you can test next
- Contrast ratios : High-impact colour blocks draw attention from 15 m away.
- Story arcs : Rotate props in sync with the seasonal rollout calendar to keep regular passers-by curious.
- Sustainability cues : Swap acrylic props for eco-smart display materials and surface those credentials on shelf talkers.
- Soundscapes : Subtle audio loops increase dwell time—track it through zone-based sensors.
- Pathway alignment : Combine sensor data with visitor flow analytics to verify that the display nudges shoppers toward high-margin categories.
Reporting tips that win budget for the next campaign
Data alone seldom sways senior leadership. Pair metrics with human-centred evidence:
- Quotes from shoppers – A quick two-question intercept survey captures sentiment.
- Heat-map snapshots – Show how visitors cluster around the display.
- SKU sell-through – Highlight specific items featured in the window and their sales spike.
Wrap your conclusions in a concise one-pager and attach a short link to an award-winning spatial design studio portfolio for inspiration.
Quick quiz: test your merchandising ROI savvy
FAQ
- How accurate are infrared footfall sensors?
- Modern dual-beam devices reach up to 98 % accuracy, provided they are calibrated monthly and positioned away from reflective glass.
- Can I isolate display impact from marketing campaigns?
- Yes. Run A/B tests across comparable stores, or use day-part analysis if campaigns and display changes overlap.
- Is footfall tracking GDPR compliant?
- Counting sensors anonymise data at source. No personal information is stored, so you only need to post standard signage informing visitors about analytics collection.
- What is a realistic payback period for window displays?
- Most retailers see ROI within four to six weeks. High-impact seasonal campaigns often pay back within ten days, as shown in the sneaker case study above.
Take action today
Install entry sensors this week, set a four-week test plan, and present your findings with the chart template above. You'll not only validate your creative ideas—you'll elevate your status as a revenue driver.
Ready to transform your shopfront into a profit engine? Book a free 20-minute diagnostic call and get a personalised ROI forecast for your next display.