Profile stats decoded 2025: turn impressions and saves into booking funnels
Tired of staring at vanity numbers that never translate into paid work? In this step-by-step guide you'll learn how to read, compare and act on your 2025 directory analytics so that every impression, click and save nudges visitors toward the “Book now” button.
Why 2025 profile analytics matter more than vanity metrics

Directories have shifted from simple listing pages to real-time marketplaces. Algorithms now factor watch-time, save-rate and response speed when deciding which profiles appear first. If you ignore the data, your competitors will out-rank you even with weaker portfolios. Understanding the stats lets you:
- Pinpoint the exact media blocks that make visitors pause or bounce.
- Reverse-engineer recruiter intent using save-to-booking ratios.
- Forecast revenue by multiplying historical conversion rates with upcoming traffic spikes.
For artists who have already added visual hierarchy tweaks that lift casting shortlist rates, fine-tuning analytics is the logical next step.
The five metrics that drive bookings (and how to track them)
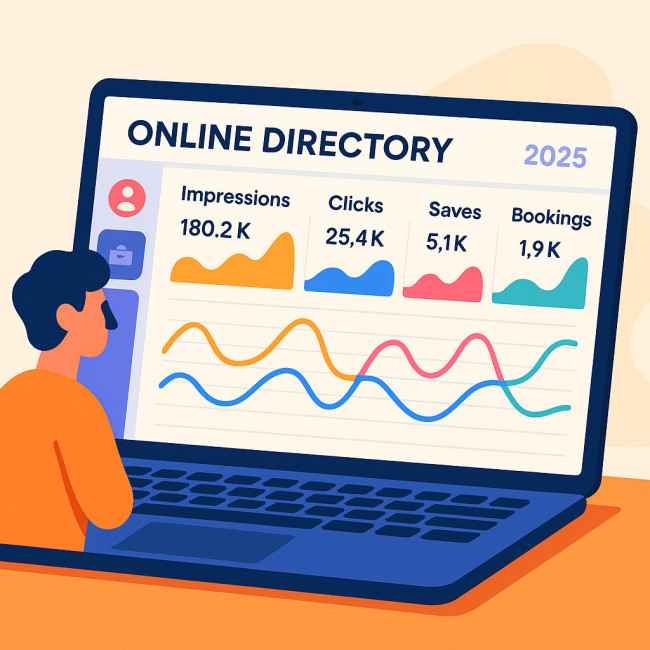
| Metric | What it tells you | Action trigger |
|---|---|---|
| Impressions | How often your card appears in search or feeds. | Audit tags and geo-filters if impressions dip. |
| Clicks | The number of visitors opening your full profile. | Test new thumbnails or titles when CTR falls. |
| Saves/Bookmarks | Users who add you to a shortlist for later. | Add social proof or niche keywords if saves stay flat. |
| Messages/Enquiries | Active outreach from recruiters or fans. | Streamline response templates to halve reply time. |
| Bookings | Confirmed paid projects through the platform. | Analyse conversion gaps and refine service packages. |
Source : HubSpot Research
From impression to enquiry: micro-optimisations that lift each step
Boost impression volume with smarter tagging
Algorithms still rely on metadata first. Cross-check your tags against trending search phrases. If you're a regional performer, replicate the approach outlined in this geo-targeting playbook: add city, genre and language fields to pop up in hyper-local searches.
Raise click-through rate (CTR) with magnetic thumbnails
Split-test two hero images for seven days each. The winner is the photo that earns a higher CTR at the same impression count. Aim for a crisp foreground subject, ample contrast and negative space for platform overlays.
Drive saves through proof and scarcity
- Add three recent testimonials overlayed on images.
- Publish limited “dates available” banners; scarcity nudges a quick save.
Convert saves to messages with friction-free funnels
Every saved profile should trigger an automated, value-packed follow-up: a quick pricing guide, a link to a scheduling tool, or a behind-the-scenes reel similar to those used by choreographers on male dancer directories. Keep the CTA above the fold on mobile.
Seal bookings by tightening response time
A 2025 study showed that profiles replying within two hours convert 60 % more often. Pre-write answers to common queries and employ push notifications so you never miss a hot lead.
Analytics in action: a 7-day sprint plan
- Day 1 – Benchmark: Export last 60 days of metrics.
- Day 2 – Hypothesise: Identify the weakest conversion step.
- Day 3 – Implement: Apply one change only (thumbnail, testimonial, price sheet).
- Day 4-5 – Promote: Drive traffic via social stories to accelerate testing.
- Day 6 – Measure: Compare conversion delta versus baseline.
- Day 7 – Decide: Keep, roll back or A/B test a variant.
Document every experiment inside a simple spreadsheet. Over a quarter you'll see compound gains without guessing.
Quiz: test your analytics IQ
Pro tips from high-performing creatives
Top earners share two habits:
- Monthly analytics reviews alongside detailed click-path heatmaps.
- Instant content refreshes—new hero image, updated rates—after every major booking.
Architects who applied similar tactics saw a 40 % lift in enquiries after reading this guide on directory filters. The lesson: data isn't just for marketers; it drives creative careers too.
FAQ
- How often should I export my analytics?
- Weekly exports give you enough data for trend spotting without drowning you in spreadsheets.
- My impression count is fine, but clicks are low. What should I tweak first?
- Swap your thumbnail or headline. A/B test two variants for at least 500 impressions each.
- What is a good overall booking conversion rate in 2025?
- 1-3 % of total impressions becoming bookings is considered strong across creative niches.
- Do paid boosts affect organic rankings?
- Yes. Short-term boosts can elevate engagement metrics that later improve organic placement.
Turn insight into income: your next move
Numbers alone won't fill your calendar—action does. Pick one weak metric today, run a seven-day experiment and track the lift. Repeat monthly and watch your profile climb leaderboards and booking calendars alike.
Ready to multiply your bookings? Start your first test now and share your wins with the community.


