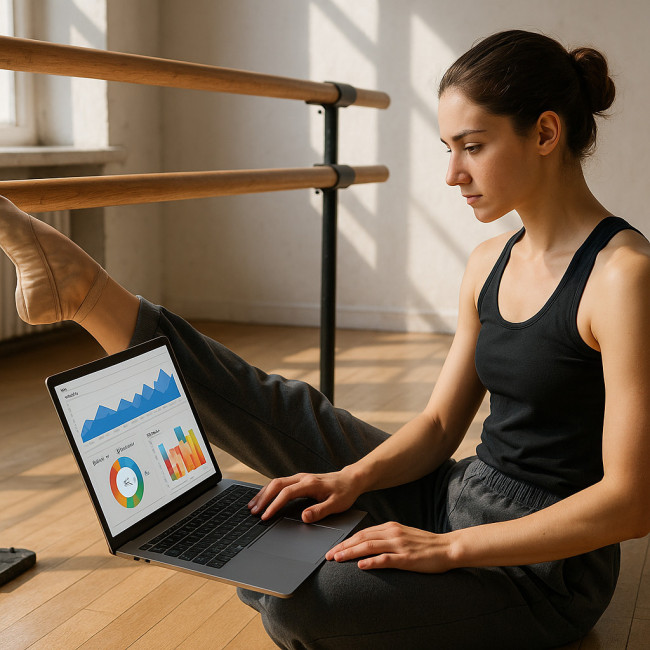
Analytics for artist websites: interpret traffic to refine your dance portfolio flow
Stop guessing what visitors think of your dance portfolio. By reading simple analytics signals—bounce rate, click-through paths, and video completion—you can reshape the flow of your pages and book more gigs, faster. Ready to translate numbers into choreography for the web? Let's dive in.
Why analytics deserve a spot in your rehearsal schedule

You rehearse routines until every move shines. Your online showcase deserves the same discipline. Web analytics reveal when recruiters drop off, which clips convince them to click “Contact,” and how new uploads alter discovery in talent directories. Armed with data, you can iterate quickly—often in a single afternoon—rather than wait for vague feedback weeks later.
Metrics that spotlight portfolio friction
Focus on a core set of signals before drowning in dashboards. Each metric below ties directly to a decision you can make today.
Bounce rate: first-click chemistry
A bounce happens when a recruiter lands on your portfolio and leaves without clicking. High bounces (>60 %) on your home or reel page mean the opening visuals or loading speed fail to engage. Compress images, swap the hero video, or shift the strongest clip to the top.
Time on page: engagement stamina
Dance is movement; time on page shows whether your audience stays for the whole performance. Low averages (<30 seconds) suggest your media starts too slowly. Trim intros and add captions so decision makers grasp your style in under eight beats.
Click-through flow: navigation choreography
Use the “User Path” or “Behaviour Flow” report to follow visitors from entry to exit. If many clicks jump from “Contemporary” to “Contact,” prioritise that genre in menus. If traffic loops between “About” and “Rates” without converting, merge those details into one streamlined page.
Video completion rate: audition readiness
Embed analytics-enabled players (Vimeo, YouTube, or native HTML5 with events). A completion rate above 65 % signals that clip length and energy work. Below 40 %? Cut runtime or front-load your most technically challenging sequence.
Conversion events: booked gigs per 100 visitors
Label each enquiry form submission, direct email click, or social DM as a “Goal.” Track the percentage of visitors who perform one. Even a lift from 2 % to 4 % translates to double the potential contracts.
Step-by-step: interpret data and refine portfolio flow
- Set a 30-day baseline. Install Google Analytics 4 or an open-source tool like Plausible. Wait one month without big site changes.
- Pick one KPI. Example: reduce bounce rate on your reel page from 68 % to 50 %.
- Hypothesise a fix. Slow video loads? Swap the 4 K file for a 1080p version.
- Implement & annotate. Note the exact date and change in your analytics tool.
- Measure for two weeks. If the metric improves and traffic is stable, keep the tweak. If not, iterate.
Tool stack: match your budget and tech comfort
| Tool | Best for | Cost | Notable perk |
|---|---|---|---|
| Plausible | Privacy-minded freelancers | €9/mo | No cookies, lightweight script |
| Google Analytics 4 | Deep funnel tracking | Free | Powerful path analysis |
| Hotjar | Heatmaps & session replays | Free tier | Visualise click hotspots |
| Matomo | Self-hosted control | Free (self-install) | GDPR–friendly |
Mini case study: 15 minutes, 36 % more enquiries
Berlin-based dancer Maya saw a 72 % bounce on her portfolio. Analytics showed a five-second blank fade before her solo appeared. She trimmed the clip, pre-loaded the thumbnail, and relocated booking details beside the video. Bounce fell to 46 % and enquiries jumped by 36 % in one month. Proof that micro-edits create macro impact.
Common issues and quick fixes
- Slow page speed. Use WebP images and lazy-load embeds; see image-speed guidelines.
- Unclear call-to-action. Add a contrasting “Book a rehearsal chat” button on every page.
- Overloaded navigation. Group similar styles into dropdowns; reference portfolio-stat strategies.
- No freshness signals. Update thumbnails monthly; understand algorithm timing via directory algorithm insights.
Sustain momentum: automate reporting
Create a weekly email digest that surfaces your top three metrics. Google Looker Studio or a Zapier-to-Sheets integration works well. A shareable report keeps you accountable and impresses agents who value data-savvy talent.
Ready to dance with data? Take the quiz!
FAQ
- Do I need coding skills to set up event tracking?
- No. Tools like Google Tag Manager let you add click, scroll, and video events via a visual interface.
- How often should I audit my portfolio flow?
- Perform a quick review monthly and a deep dive every quarter, especially after adding new choreography videos.
- Which traffic sources convert best for dancers?
- Referral visits from fresh dance portfolio listings tend to show higher intent than generic social media clicks.
- What is a healthy bounce rate for a media-heavy site?
- Aim for 40–55 %. Below 40 % is excellent. If you show autoplay videos, expect slightly higher figures.
- Can analytics hurt loading speed?
- Yes, if you install multiple tag managers. Stick to one script, defer its loading, and opt for lightweight platforms.
Take your next step
Analytics translate silent visitor behaviour into clear choreographic notes for your website. Start tracking today, apply one change per week, and watch your enquiries climb. Need deeper guidance? Explore analytics mindset tips for performers and turn every metric into a standing ovation.
Ready to audit your flow? Open your dashboard now, set a baseline, and let the data lead your next creative leap.


