Lighting-audio coordination grids that simplify multi-sensory exhibition builds
Building an immersive exhibition means juggling dozens of lighting, sound and interactive cues. A coordination grid transforms that chaos into a clear roadmap, so crews sync every flash and beat on time, within budget and without last-minute stress.
Why exhibitions need a coordination grid
Multi-sensory shows wow visitors, yet they also introduce complexity. One lighting change can sabotage an audio fade if teams are not perfectly aligned. A grid documents every cue—location, timestamp, intensity, colour, decibel level—on one shareable sheet. This simple visual makes dependencies obvious and slashes on-site troubleshooting.
- Speed: Crews pinpoint conflicts during pre-build meetings, not during opening week.
- Cost: Fewer technician hours and rental over-runs reduce spend by up to 18 % according to AVIXA cost benchmarking.
- Visitor impact: Seamless transitions lift perceived quality, which correlates with 22 % higher dwell time in Experience Economy studies.
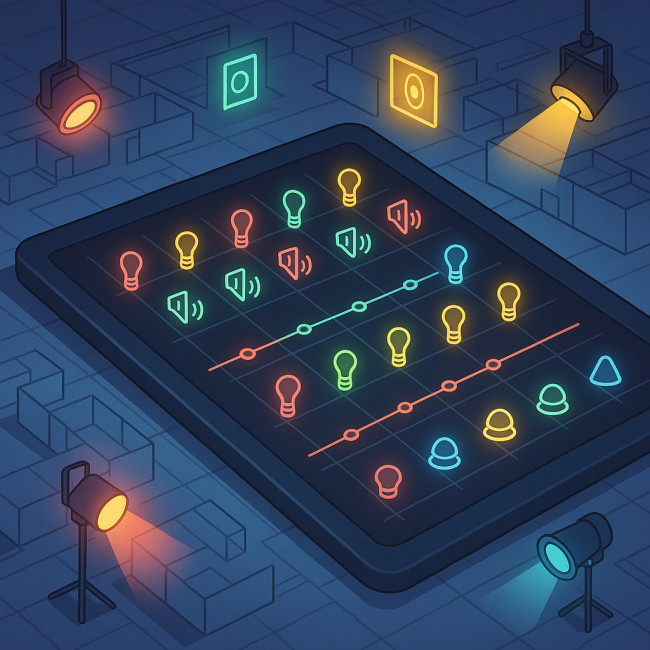
Key elements of a lighting-audio grid
1. Cue reference
Assign a unique ID such as L01 or A14. Use a consistent prefix so software and printed sheets stay readable.
2. Timeline column
Timecode (hh:mm:ss:ff) lets technicians program consoles accurately. Include an offset column if your show loops.
3. Spatial coordinates
Mapping fixture numbers to floor-plan zones avoids “which spotlight?” arguments. Add height for multi-level rigs.
4. Intensity & colour
List DMX values or Kelvin temperatures. For audio, note decibel targets, EQ presets or spatial audio pan data.
5. Trigger source
Touch screen, pressure pad, OSC command—state the device that fires the cue. This becomes vital when integrating interactive layers later.
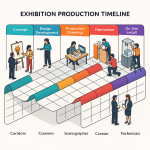
Step-by-step: building your first grid
- Sketch the visitor journey. Outline each narrative beat. If you need help quantifying flow, see our guide on data-driven visitor flow analytics.
- List all fixtures. Export from your lighting plot and audio patch list. Consolidate into one spreadsheet.
- Assign cue IDs. Work chronologically; reserve gaps for last-minute additions.
- Define triggers. Collaborate with the interactive team so sensors arrive in the right part of the grid from day one.
- Colour-code risk. Mark high-complexity cues (cross-fade + moving head + sound pan) in amber to schedule extra rehearsal.
- Lock version control. Use cloud sheets or a show-control app so everyone edits the latest copy.
Toolbox: software and hardware that accelerate grids
While Excel or Google Sheets work, dedicated show-control tools remove manual entry and push grid data straight to consoles.
| Feature | Manual spreadsheet | Show-control platform |
|---|---|---|
| Real-time sync | No | Yes (OSC / SMPTE) |
| Error alerts | None | Highlights overlapping cues |
| Mobile access | Read-only PDF | App with live updates |
| Cost per show | ≈ €0 | €150-€600 licence |
For complex museum tours, that licence quickly pays back through shorter focus sessions. When pitching, embed a grid preview in your spatial-design portfolio to reassure curators of your process depth.
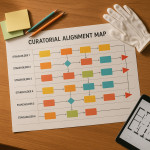
Integrating grids into the design pipeline
You can draft grids right after concept approval. Using VR pre-visualisation pipelines, import cue IDs as markers inside the virtual model so stakeholders “see” triggers as they walk the space.
Eco-friendly gains
Coordinated programming cuts overnight testing hours, shrinking energy draw. Combine the grid with the eco-smart materials roadmap and your sustainability report instantly gets stronger.
Accessibility alignment
Documenting every strobe and bass drop early also helps you adapt for sensory-sensitive audiences. Pair the grid with inclusive design guidelines to meet accessibility legislation without redesigning late.
Case study: grid versus ad-hoc coordination
The museum of Industrial Futures piloted a 12-room multi-media show. Half the rooms used a grid; the others followed traditional separate lighting and audio sheets.
| Metric | Without grid | With grid |
|---|---|---|
| Programming days | 14 | 9 |
| Post-opening fixes | 27 issues | 6 issues |
| Visitor satisfaction score | 7.9 / 10 | 9.2 / 10 |
| Energy over-runs | +11 % | +3 % |
The production lead noted that clear ownership and faster debugging were the standout benefits.
Common pitfalls and how to avoid them
- Version drift: Nominate one “grid captain” who approves edits before they go live.
- Over-detailed cells: If a cue description runs beyond two lines, split it into micro-cues. Consoles handle short instructions better.
- Forgetting maintenance modes: Add a “service” tab covering lights that need to switch to safe levels when cleaners enter.
Mini quiz: test your coordination IQ
FAQ
- Is a coordination grid useful for small pop-up exhibits?
- Yes. Even with five light fixtures and one audio track, a grid keeps freelance crews aligned and reduces rehearsal time.
- Which file format works best?
- CSV ensures compatibility with consoles and show-control apps. Export a read-only PDF for stakeholders who only need to review.
- How often should I update the grid during build?
- Daily during installation, then whenever a cue changes during rehearsals. Freeze it 24 h before press preview.
- Can grids integrate with sustainable energy tracking?
- Absolutely. Add a column for wattage per cue. Summing that column gives you real-time energy forecasts.
Next steps
Download a template, schedule a cross-discipline workshop and draft your first ten cues. For more strategic alignment tips, read our article on crystal-clear scenography briefs. Master the grid today, and your next multi-sensory build will run like clockwork.
Ready to impress your next curator? Adopt coordination grids now and watch client confidence skyrocket.