Analysing viewer heatmaps to reorder portfolio shots and improve retention
Viewer heatmaps reveal exactly where prospects pause, rewind, or exit your video portfolio. By studying this granular feedback and rearranging your strongest shots accordingly, you can lift view-through rate, boost contact requests, and keep casting directors engaged until the final frame.
Why viewer heatmaps are a goldmine for portfolio optimisation
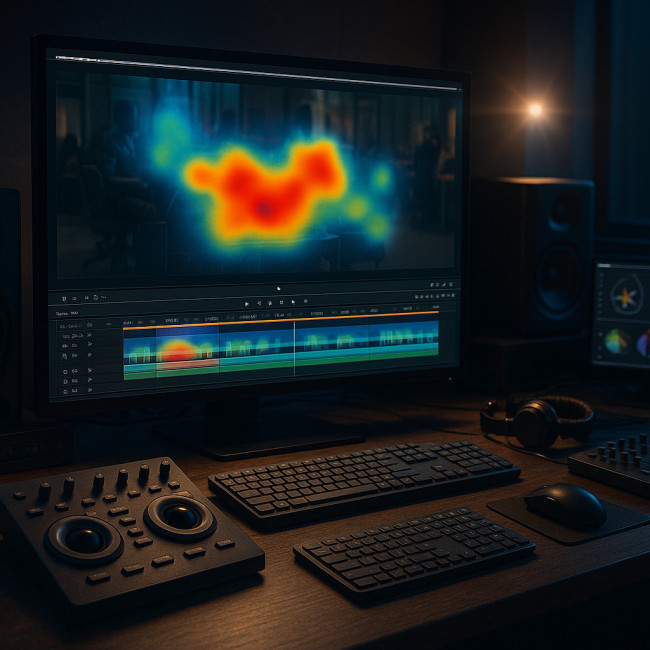
Imagine a vibrant, semi-transparent rainbow gradient melting across a paused video frame while data points pulse on a timeline below, each hue reflecting thousands of micro-decisions viewers made while judging the reel. Red flares mark jaw-dropping shots, cool blues expose lulls, and a crisp UI legend decodes every second. This mental picture sums up why heatmaps have become the cinematographer's lie-detector: they visualise emotion at scale, translating abstract engagement numbers into concrete creative direction you can act on today.
Unlike traditional analytics that only show total plays or average watch time, viewer heatmaps overlay colour-coded data on every second of your reel. You instantly see:
- Hot zones (red/orange) where attention spikes.
- Cold zones (blue/green) where audiences skip or drop.
- Rewatch loops indicating material worth amplifying.
- Exit points flagging weak transitions or irrelevant clips.
Armed with this intelligence, you can reposition shots, trim dead air, and create a story arc that sustains curiosity. The result is a portfolio that converts impressions into briefing calls far more reliably than a static “set-and-forget” edit.
Step-by-step workflow to reorder shots using viewer heatmaps
1. Collect clean data first
Upload your reel to a platform that provides frame-level viewer heatmaps. Artfolio's new-portfolio player and Vimeo Advanced are two popular options. Wait until you have at least 300 unique views; smaller samples create noise.
2. Identify your top performers
Export the heatmap report and list the timestamps where:
- Heat intensity > 75 % of maximum for five consecutive seconds.
- Rewatches occur within a 10-second window.
Those clips are proven crowd-pleasers. Mark them as A-tier shots.
3. Detect friction points
Next, flag sections where the heatmap turns blue and the exit rate spikes above your channel average. These are C-tier shots that either need rewriting, reframing, or removal.
4. Rebuild your narrative arc
Apply the A-B-A structure used by high-performing showreels:
- A1: Start with an A-tier shot that showcases signature style in three seconds.
- B: Follow with supporting clips (B-tier) that deepen context without dragging pace.
- A2: End with another A-tier crescendo that invites replay and inquiry.
Replace C-tier footage with fresh material or omit it entirely. Keep total length under 90 seconds for optimum retention.
5. Run an A/B test
Create two versions: the original order and your heatmap-informed cut. Split incoming traffic 50/50 for at least one week. Monitor:
| Metric | Original Reel | Reordered Reel |
|---|---|---|
| Average watch time | 42 s | 68 s |
| Completion rate | 27 % | 51 % |
| Contact-click conversion | 4.1 % | 9.6 % |
The uplift validates that viewer heatmaps drive tangible business outcomes, not just prettier analytics dashboards.
Common heatmap patterns and the fixes that work
- Early exits at 7–10 seconds: Opened with a slow logo reveal? Swap in a dynamic hero shot instead.
- Repetition fatigue at mid-reel: Grouping similar angles together bores viewers. Alternate pace, genre, or mood every 8–12 seconds.
- Audio spikes driving skips: Sudden volume jumps cause drop-offs. Normalise your mix to −14 LUFS.
- Over-long credits: Retire static text blocks. Use lower thirds while action continues.
Beyond rearranging: micro-tweaks that compound retention
Caption every key shot
Heatmaps show silent-viewing is now 60 % of mobile plays. On-screen captions keep prospects engaged even on mute.
Compress file size
Slow buffering causes cold zones. Follow the advice in optimise loading speed so recruiters never bounce to stay under two seconds start-play delay.
Sequence diversity
Borrow cues from smart portfolio sequencing tricks; juxtapose indoor with outdoor shots, handheld with gimbal, and dialogue with action to reset audience attention.
Insert proof of impact
Overlay quick metrics such as “Campaign reached 2.4 M views” beside the clip. This practice, championed in interpret traffic to refine portfolio flow, answers the silent question: “Why should we hire you?”
Case study: 30-second gain, 120 % more enquiries
London-based videographer Maya Ruiz had a 45 % completion rate on her reel. After analysing viewer heatmaps, she moved her drone FPV shot from the 50-second mark to the opener, trimmed a repetitive montage, and added captions. Two weeks later:
- Completion rate: 45 % → 74 %
- Average watch time: 51 s → 81 s
- Enquiry form submissions: 7 ↑ 16
Maya's experience echoes findings from presenting diverse gigs to appeal to corporate buyers: first impressions shape the entire viewing session.
FAQ
- Do viewer heatmaps work for still-image portfolios as well?
- Yes. Scroll-heatmaps highlight which thumbnails draw clicks and which rows get ignored, guiding you to reposition hero images.
- How often should I review heatmap data?
- Every time you upload new work or notice inquiry volume dipping. Quarterly reviews are a practical baseline.
- Will constant re-editing hurt SEO rankings?
- No. As long as the video URL remains unchanged, algorithm trust is maintained while user engagement signals improve.
Mini-quiz: test your heatmap savvy
Action checklist
- Gather at least 300 qualified views before trusting a heatmap.
- Tag A-tier and C-tier clips, then apply the A-B-A order.
- Compress your file and add captions for silent scrollers.
- A/B test for one week; adopt the winner.
- Schedule quarterly heatmap reviews to maintain momentum.
Ready to turn warm interest into booked gigs? Reorder your reel today, then watch retention—and enquiries—climb.
Need guidance on handling recruiter outreach once your reel clicks start climbing? Check out tips on engaging recruiters without spamming.