Land art site maps: presenting scale and context clearly in your online showcase
When recruiters and curators skim your portfolio, one element helps them grasp the ambition of your outdoor work in seconds: a clear, well-labelled land art site map. Learn how to build, optimise and publish maps that highlight scale, terrain and visitor flow—without slowing your website or confusing viewers.
Why a dedicated land art site map is non-negotiable
Land art lives and breathes through context. A sculpture that looks monumental in a studio shot might shrink to toy-size in an open valley. By adding a concise land art site map, you unlock instant comprehension for busy reviewers, curators and local authorities alike; the graphic pre-answers questions about access, safety buffers, material volume, and environmental impact before they even open your proposal, saving everyone time and eliminating costly rounds of clarification. It is, in essence, the visual elevator pitch of large-scale ecological artwork: fast, data-rich and impossible to misread.
- Communicate scale—exact dimensions and footprint reassure planners about logistical feasibility.
- Show ecological respect—overlaying habitats or soil zones proves you design responsibly, echoing advice in soil-safe material guides.
- Guide visitor experience—entrance points, paths and viewpoints suggest how audiences will discover the piece.
- Speed up recruitment—decision-makers compare sites faster, just as they do with drone flyover videos.
Key layers every land art site map should include
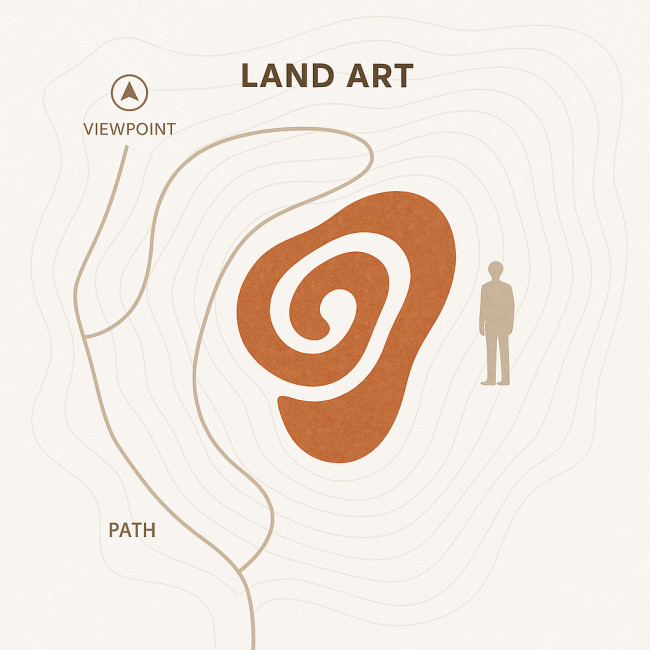
1. Boundary & footprint
Outline the exact perimeter of your installation. Use contrasting colour or dashed strokes. Include total square metres and the longest span in metres or feet so recruiters visualise crane reach and material volume.
2. Dimensions & human-scale cues
Recruiters struggle to convert numbers into mental images. Add silhouettes of a person, vehicle or tree at the same scale beside your artwork. The land art site map instantly conveys relative magnitude.
3. Topography & ecological context
Contour lines, water courses and vegetation patches reveal how your piece embraces the environment. A topographic backdrop prevents misunderstandings around gradient, drainage and foundation safety.
4. Access, logistics and viewing points
Mark delivery roads, visitor trails, parking, disabled routes and best vantage spots. This proves you have considered the audience journey—a requirement already stressed in impact metric discussions.
5. Seasonal variables
If your artwork relies on snow, blossom or low sun angles, annotate seasonal changes. Link back to research undertaken during seasonal site scouting to show due diligence.
Choosing the right mapping tool for artists
| Tool | Best For | Export Formats | Cost Range |
|---|---|---|---|
| QGIS | Data-rich ecological overlays | SVG, PNG, GeoJSON | Free, open source |
| Illustrator + Mapublisher | Highly stylised maps for brand alignment | AI, PDF, SVG | $$—subscription + plugin |
| Google Earth Studio | Animated fly-throughs to pair with drone footage | MP4, PNG sequence | Free (application) |
| Civil 3D | Engineering-grade grading plans | DWG, DWF, PDF | $$$—licence |
Step-by-step workflow to craft a compelling land art site map
- Survey the terrain. Combine drone photogrammetry with handheld GPS points. Align imagery with local coordinate systems.
- Clean the base map. Remove unnecessary satellite clutter. Highlight only contours, water bodies and tree lines that inform the artwork.
- Add the artwork layer. Import your 3D model footprint or hand-drawn outline. Stick to one bold colour to stand out.
- Insert scale references. Place a 1.8 m human figure icon and a 5 m grid. These universal cues help global recruiters.
- Label intelligently. Use short tags: “Main axis 42 m”, “Viewing berm +2 m”. Limit font families to two for readability.
- Export web-ready files. Optimise SVG under 500 KB and fallback PNG under 150 KB. Maintain a 16:9 ratio for social teasers.
- Embed interactively. Host the SVG inline so text remains sharp on retina screens. Provide an accessible description.
Web optimisation tips that preserve detail
File size versus clarity
Compress unnecessary paths and flatten hidden layers before export. A crisp 300 ppi PNG beats a bloated 8 MB TIFF that stalls page load.
Responsive behaviour
Set viewBox attributes in your SVG so the land art site map scales fluidly on mobile. Test breakpoint readability at 320 px width.
Colour & accessibility
Stick to WCAG-compliant contrast ratios. Earth tones (#95854c, #555555) against pale backgrounds keep the map elegant yet legible for colour-blind users.
Interactive elements
Add hover tooltips explaining each segment. Recruiters can dive into technical notes without leaving the page, similar to navigation patterns on the new creatives portfolio page many studios browse daily.
Case study: from drone survey to clickable map
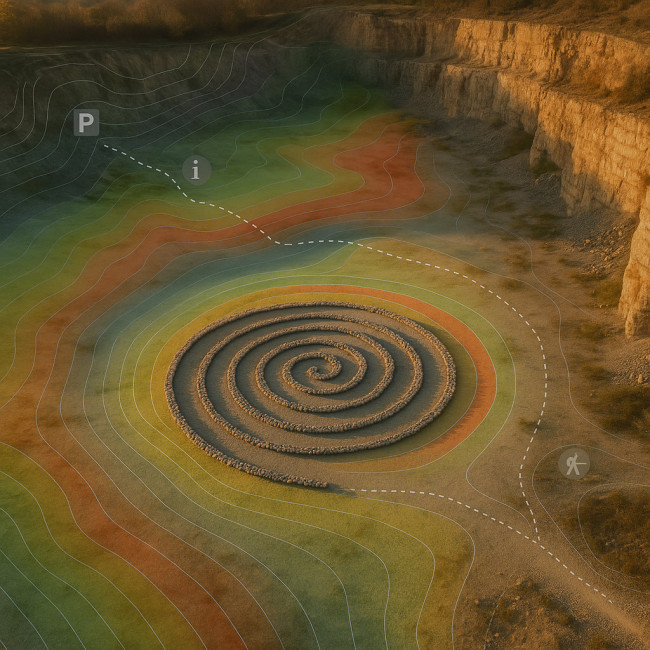
Artist Maya Torres transformed a 400 m spiral of reclaimed stone in a former quarry. The public artwork sprawls across nearly four football fields, dipping into turquoise water pockets left by decades of extraction and climbing back onto sun-baked terraces. Because visitors approach from multiple elevation levels and heavy machinery had to negotiate narrow switchback roads, context was critical. Her land art site map became the linchpin document for engineers, insurers and curators, outlining exact crane clearances, amphibian nesting buffers, and sunset viewing arcs long before the first boulder was hauled into place. She followed these steps:
- Commissioned a 15-minute drone flight (see drone flyover best practices) to generate a 2 cm/pixel orthomosaic.
- Imported data into QGIS, digitised contour intervals and traced the spiral path.
- Exported an SVG at 120 dpi, then layered semi-transparent colour bands to indicate elevation gain.
- Embedded the map on her homepage with ARIA labels, resulting in a 27 % longer average session time and two international commission inquiries within a month.
Publishing checklist
- Compress SVG < 500 KB
- Include descriptive
<title></title>and<desc></desc>elements for screen readers - Lazy-load fallback PNG for slow connections
- Test on Chrome, Firefox, Safari and one Android browser
- Verify map colours on both light and dark mode
Interactive Quiz: Test your mapping savvy
FAQ
- Do I need expensive software to create a land art site map?
- No. Free options like QGIS or InkScape handle most tasks. Invest only if you require advanced civil engineering features.
- How many times should the term “land art site map” appear on one page?
- A natural density of 1–2 % keeps search engines happy without sounding robotic. Prioritise readability over keyword stuffing.
- Can I replace a map with drone footage alone?
- Drone videos impress but lack precise dimensions. Combine both for maximum clarity.
- What is the best orientation for mobile users?
- A portrait-friendly 4:5 ratio or a responsive SVG ensures labels remain legible on small screens.
- Should I show protected ecological zones publicly?
- Blur sensitive coordinates or present approximate buffers to avoid attracting unauthorised visitors.
Ready to upgrade your showcase?
Clear land art site maps bridge the gap between awe and understanding. Implement the checklist above, pair it with strong impact metrics, and watch your commission pipeline grow. Need more portfolio tips? Explore our guide on grant-ready budgeting for land art.
Action step: Draft your first map today and embed it on your homepage before your next pitch.